Out of curiosity, I wanted the other day at work to get more clarity on the Threads we have in a Spring Webapp. To be more precise I wanted to see how many threads are there, what’s going on in each thread, get insight on threads context switching. This blog summarizes the tools I used on Ubuntu and how to make sense out of the data I found.
Too Many Threads?
It’s no secret that in order to properly harness the power of modern-days CPUs you have to utilize threading. Let’s say I have some problem that I can solve concurrently. As I start allocating more threads to do the work, I’ll notice a boost in performance. However at some threshold, There is going to be a decline in performance, and processing will get slower. The reason behind that is Context Switching.
The CPU can only run a certain number of threads at the same time. “lscpu” gives some insight on this.
> lscpu
Architecture:          x86_64
CPU op-mode(s):        32-bit, 64-bit
Byte Order:            Little Endian
CPU(s):                4
On-line CPU(s) list:   0-3
Thread(s) per core:    2
Core(s) per socket:    2
Socket(s):             1
NUMA node(s):          1
Vendor ID:             GenuineIntel
CPU family:            6
Model:                 61
Model name:            Intel(R) Core(TM) i7-5600U CPU @ 2.60GHz
The number of threads my system can run simultaneously at the same time is:
Sockets * Core Per Socket * Threads Per Code = 4When running multiple threads, A Scheduler will allocate a slice of time for each thread, and switch the execution between them (Context Switching). This switch comes with on overhead that will impact the overall performance.
There are two types of context switching
- Voluntary Context Switching: Happens when a thread writes to an IO, or requests a resource that is not available.
- Involuntary Context Switching: Happens when a thread exceeds the time slice that the scheduler has assigned
pidstat
pidstats can monitor a process activity. It can display all the threads associated with a process, IO activity per thread, thread context switching and many more
pidstat -w -d -t -p <PROCESS_ID> -h <INTERVAL>
- -w: displays voluntary\involuntary context switching per second per thread
- -d: prints IO read\writes per second
- -t: shows stats for all threads associated with the process
- -p: process Id
- -h: will display the stats for each thread on a single line, making it easier to read.
- <INTERVAL>: This will put pidstat in watch mode. It will update the stats according to the interval you specify
Enough theory, let’s get to action.
First off, I need to get the processId for my webapp. I can find it in two ways:
- via command line using ps
ps aux - via GUI using “System Monitor”
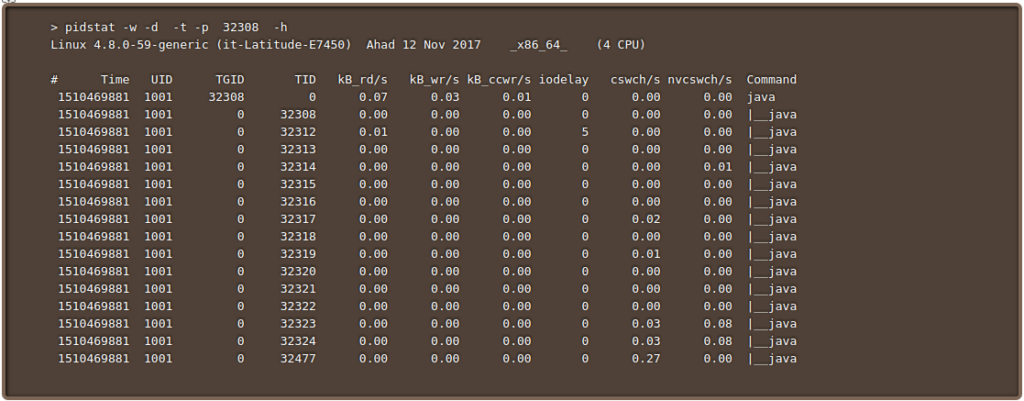
Now that I have my pId (32308), I can use pidstat
Upon looking at the result a couple things stood out:
- I trimmed the result as there are around 200 threads running.
- One Thread stood out “32477”. It has a very high voluntary context switching which got me curious.
- No threads were doing any involuntary context switching, because the webapp was idle (which is expected). I wasn’t sending or receiving any requests.
This is nice but It’s not as helpful as I had hoped. If I were to find a thread with a very high context switch, I couldn’t really map it back to my code to figure out what was going on. Also I’m curious about the “32477” thread, but I don’t really know what it is.
jstack
Since the webapp is written in java, I can utilize one more tool that is shipped with the jdk. jstack will display the state of all threads associated with a jvm based process, along with the callstack of each thread.
jstack <PROCESS_ID>
jstack displays the threadId in lowercase hex, however pidstat uses the decimal system. So I need to convert my threadId (32477) to lowercase hex (7edd).
> jstack 32308 | grep 7edd
"scheduler-1" #54 prio=5 os_prio=0 tid=0x00007f7ccb60a000 nid=0x7edd waiting on condition [0x00007f7cbda4e000]
This is much nicer. The thread in question has a human readable name (“scheduler-1”). I think It makes sense for a scheduler to have a higher voluntary context switching, as it is constantly waiting for new tasks\jobs to execute.
Note: running jstack without the grep displays the callstack of each thread.
Debugging with psidstat and jstack
I was stuck trying to figure out why a certain page in the system takes ages to load (4mins, after the introduction of big changes). I tried to place break points and follow through the logic, but I didn’t find anything unusual. I decided to use what I just learned “psstatid” and “jstack” to track down the issue. After initiating a request, I switched to “psstatid” and was able to identify the thread that handled the http request. It had very high and constant voluntary context switching. I switched back to jstack and printed the threads callstack to log files at different interval
jstack 32308 > log1.log
I went through 10 log files for the thread handling the http request and examined the callstack. I was able to identify a method that should never hit IO but was actually executing transactions on the db. The Class was annotated with @transaction attribute (Spring + Hibernate integration). It was just a matter of applying a fix and the page loading time went back to normal.
Summary
The combination of psidstat and jstack can provide a clarity on the internal state of the system and can be utilized in debugging:
- unexpected constant high involuntary context switch points to a thread with very long computational tasks (or maybe a thread stuck in some infinite loop).
- unexpected constant high read\write or voluntary context switch points to a misimplementation where a thread might be abusing the IO,
I put high emphasis on unexpected as this depends on the usecase
