awhile ago i run into performance issues with two services at work, and couldn’t figure out what was causing the high response time. I had to bring out the big guns and used FlameGraphs to gain a better insight on what are the hot codepaths.
Getting Started
I followed this guide written by Brendan Greg on generating flamegraphs using perf. I couldn’t get perf from linux-tool package to work as the container’s host was running a custom kernel version. I had to compile perf from Linux repo and hunt down all the required dependencies. I’ve included the steps in this gist
The sinful JSON.parse(JSON.stringify(..))


Mutations are the source of plenty of bugs in a large enough codebase. One technique to preserve immutability I’ve been seeing is JSON.parse(JSON.stringify(..)) to create a clone of an object\parameter to prevent mutations from leaking outside a function. The problem with such approach is that JSON.parse and JSON.stringify run on the main thread of nodejs which impacts heavily systems that need to service high throughput.
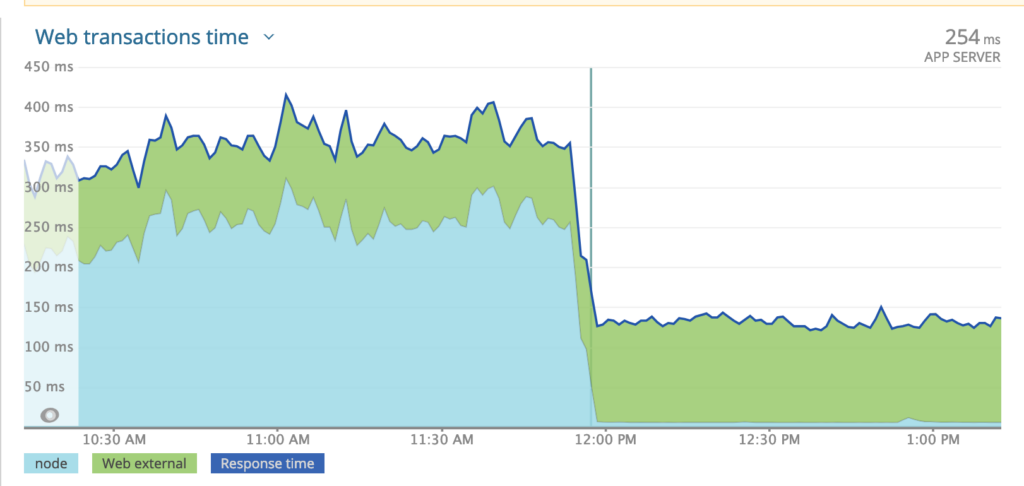
This exact callstack was distributed all over the flamegraph that i generated. After eliminating all of the calls to JSON.parse and JSON.stringify the response time of the service increased drastically.
I do believe that immutability should be a discipline and easy escapes like creating deep-clones should be avoided at all cost. The spread operator offers a fast way of changing objects while preserving immutability
Closures, Callback..Where is My Code

given how nodejs relies heavily on closures and callbacks. Looking at a stackframe might not tell you exactly where a call has originated from.
This is a callstack made to aws-sdk. Examining the callstack top to bottom won’t show any functions from my source code. In such cases it was necessary for me to understand the sourcecode i’m profiling
Dafuq GRPC

This one is a mystery to me that i still can’t explain. I profiled one service that uses grpc to communicate with an upstream. The services use bidirectional stream to communicate. The flamegraph yielded a surprising result. The graph showed that 30% of the cpu time was being spent in grpc land
I’m not sure if this is due to the overhead of protobuff deserialization or something else. Comparing the response time after moving the services away from grpc to REST is shocking
Given what I keep hearing about grpc performance, i’m convinced that i’m missing something here. I just don’t know what it is.